In gate level simulation (GLS), one of the hard task is 'X' propagation debug. This use case shows how to turn Gates On the Fly and other ordinary waveform display into a powerful 'X' source debug tool.
The solution is to integrate waveform tool like QuestaSim or Verdi and Gates On the Fly by TCP/IP link. The waveform tool works as a server and GOF connects as a client, as shown on Figure 1.
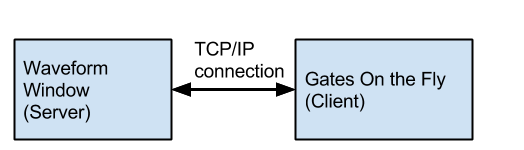
Figure 1, TCP/IP link
When GOF is expanding an incremental schematic, the signals values are transfered from the server and displayed on the schematic. User can decide how to trace the 'X' source accordingly. Or use X-tracing command to show the root cause of 'X' directly.
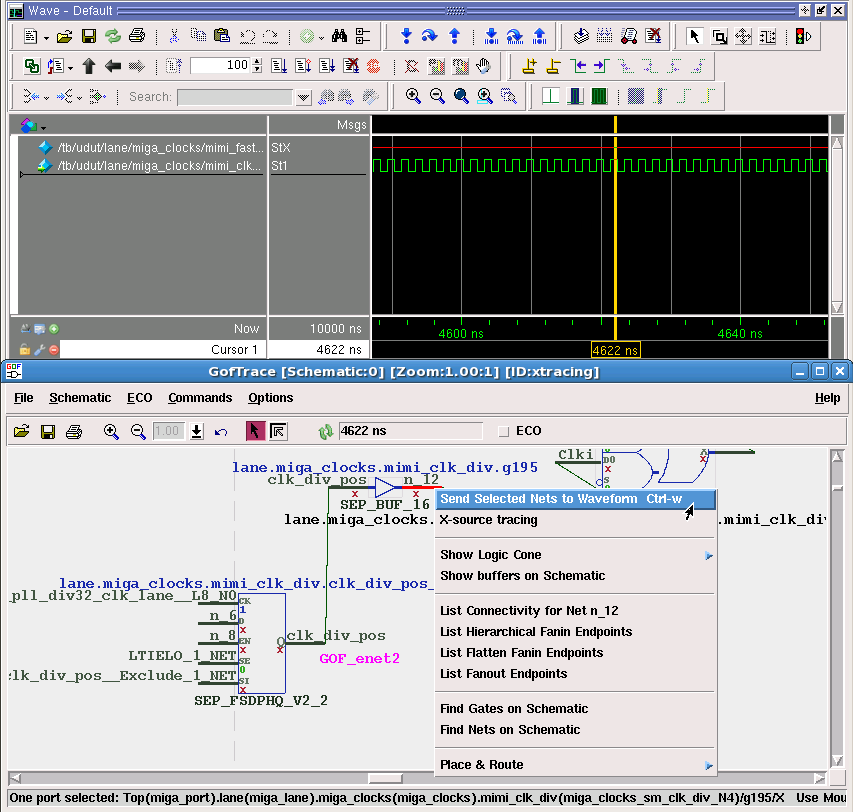
Figure 2, GOF interacts with Waveform
The current version V4.3 of GOF supports two waveform tools, QuestaSim and Verdi.
If the waveform tool is QuestaSim, bring up QuestaSim waveform by 'vsim -view vsim.wlf'. Enable Transcript window by menu View->Transcript.
Run TCL server script in Transcript window. The TCL script is in GOF release, "GOF/examples/x_tracing/wave_server.tcl". After the script is run, QuestaSim is in a server state waiting for GOF to connect back as a client.
Figure 3, Run server script on QuestaSim
If the waveform tool is Verdi, check 'Enable TCL Command Entry Form' in Verdi Preferences window.
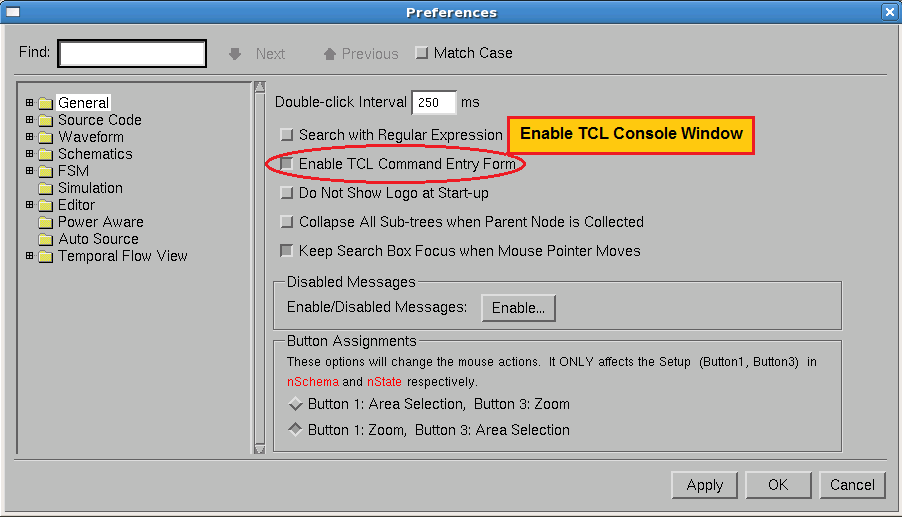
Figure 4, Verdi enable TCL Console
In Verdi TCL console, Command Entry window, run "GOF/examples/x_tracing/wave_server.tcl".
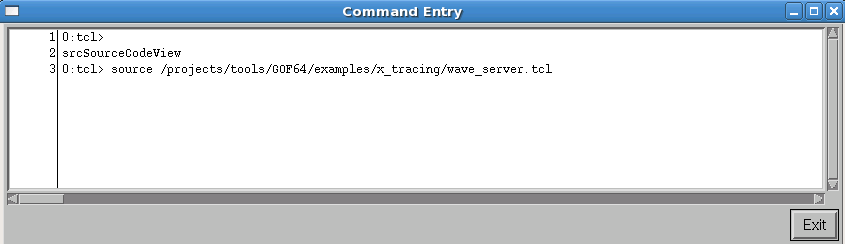
Figure 5, Run server script on Verdi
Note: The default TCP/IP port number is 5100, and it can be adjusted as needed.
In client side, bring up GOF by command line, 'gof -lib tsmc40nm.lib netlist.v'. It's highly recommended to use liberty .lib files for library cells instead of verilog library files.
When GofViewer window is up, click 'New Schematic' to launch schematic window.
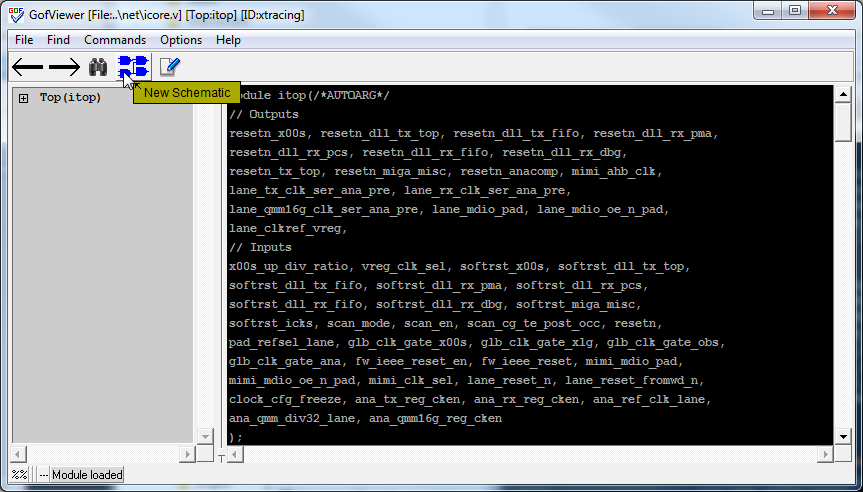
Figure 6, Launch Schematic
In schematic window, GofTrace, use menu Commands->'Communicate with Waveform Window' to launch communication setup window.
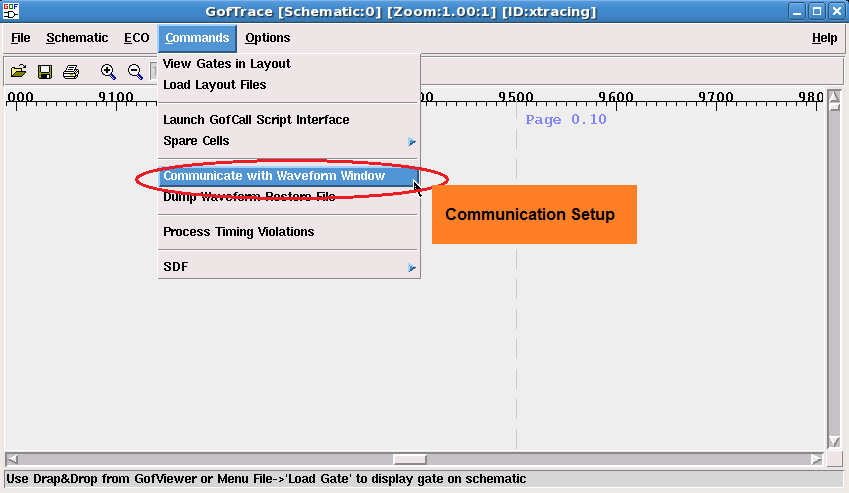
Figure 7, Launch communication setup window
To setup TCP/IP link with waveform tool correctly, these 5 items should be configured.
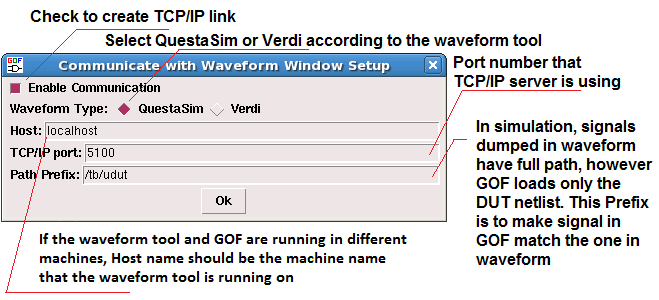
Figure 8, Communication setup options
If the configuration is good, 'Successfully Connecting to Waveform Window' message appears at the left bottom corner. Time refresh button and current time indicator are displayed on menu bar.
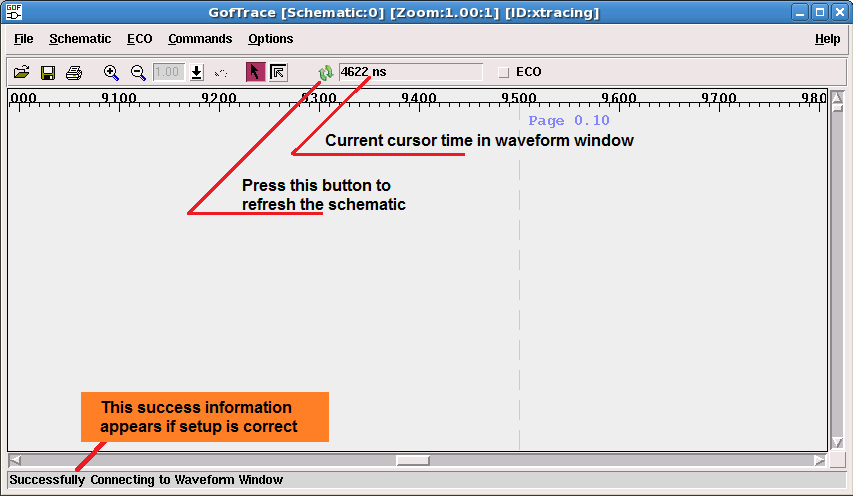
Figure 9, Correct configure result
If something goes wrong, error message 'ERROR! Failed to setup communication socket' appears at the left bottom corner. The cause can be either server not running or the client configuration being not correct.
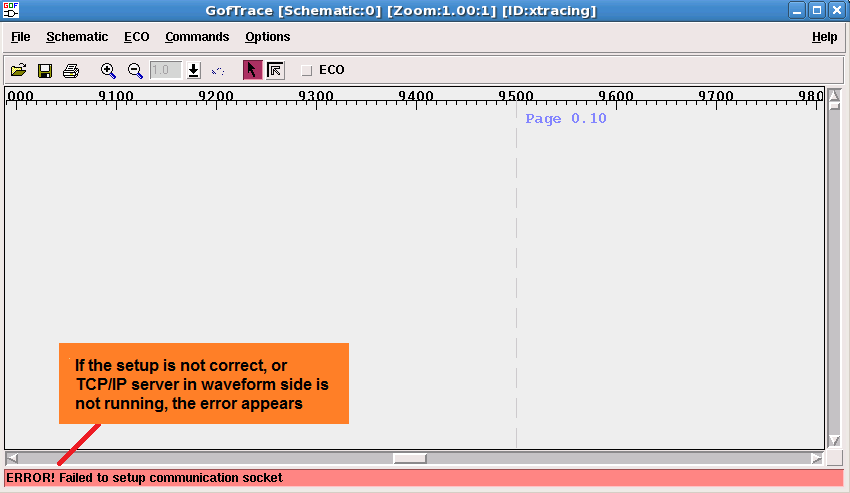
Figure 10, Error in configuration
Now it's time to debug the gate level simulation result.
Use ctrl-g to load a gate that is under investigation.
The pins of the gate have waveform values annotated which can be '1', '0', 'X', 'Z' or transition format like falling edge '1-0'. If a pin can't be found in waveform database, it is annotated as 'NA'.
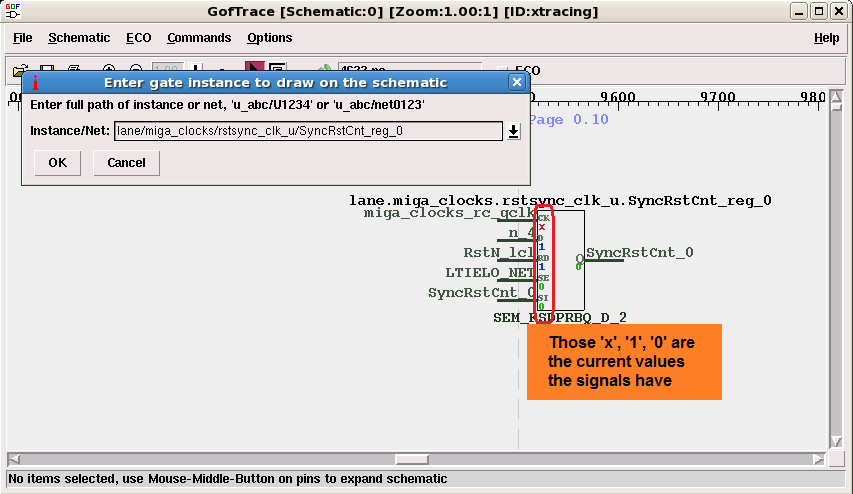
Figure 11, Load a gate
User can click mouse-left-button on a pin annotated with 'X', and click mouse-right-button to pop up menu and choose 'X-source tracing' command.
User can do 'Send Selected Nets to Waveform' command to display the signal on the waveform window.
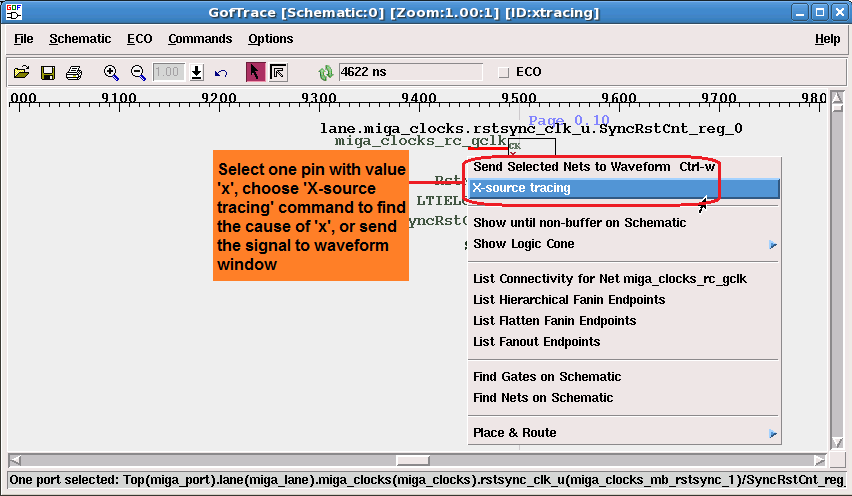
Figure 12, Run X tracing command
A text window pops up with endpoints listed and the current values are also listed on the window. The endpoints with value 'X' are the root causes of that 'X' signal.
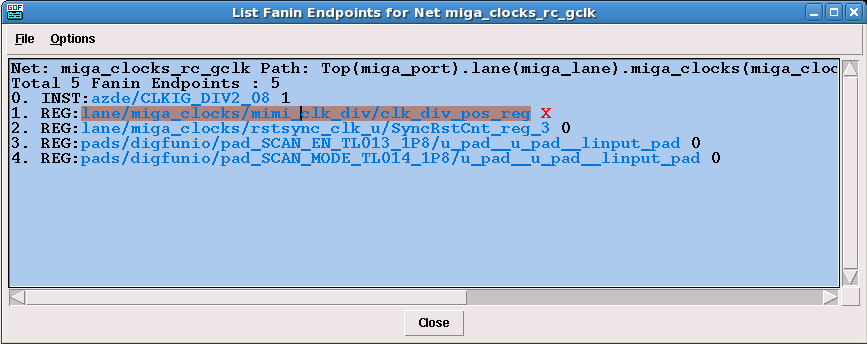
Figure 13, Result of X-source tracing
The 'X' source endpoints can be send back to the schematic for further analysis. User can do more 'X-source tracing' on 'X' pins, or use mouse-middle-button on 'X' pins to expand the schematic.
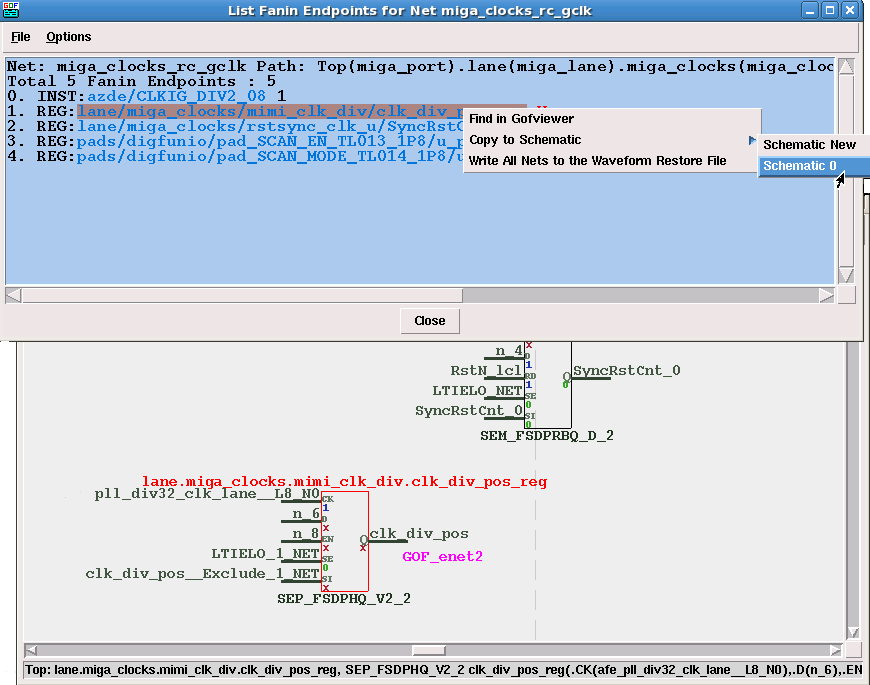
Figure 14, Send endpoints back to schematic
Using mouse-middle-button to click on 'X' pins, user can control how the schematic is drawn. When a signal is driven by chain of buffers, like clock signal, 'Show until non-buffer on Schematic' command can be used to speed up the buffer tree tracing.
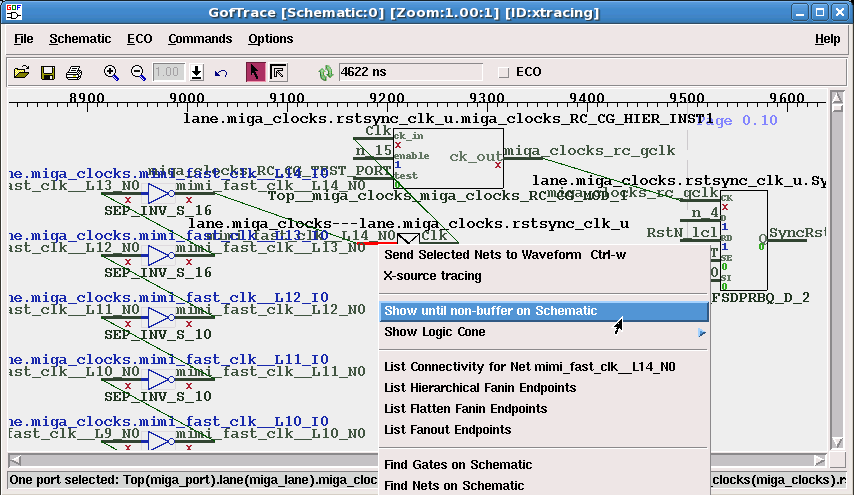
Figure 15, Schematic tracing
By following the 'X' pins, the schematic can get to the point of 'X' source, like the result in 'X-source tracing' command.
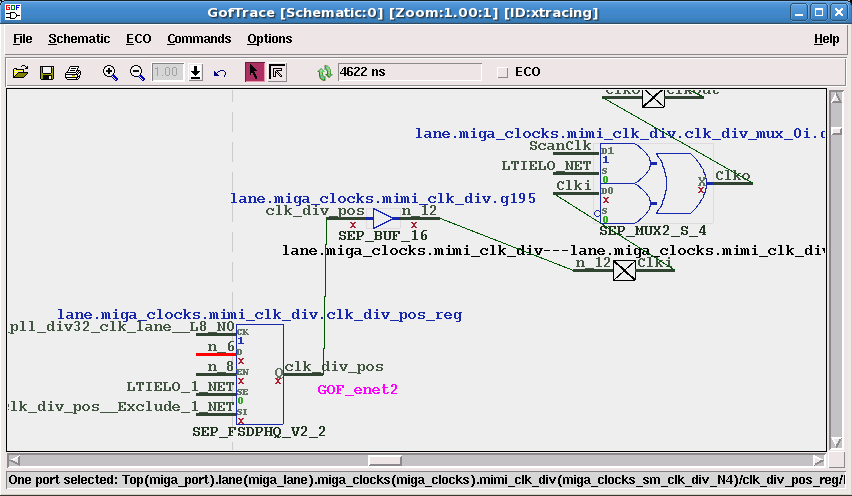
Figure 16, X source tracing result
Combining waveform tool with GOF, the partial schematic feature of GOF can be turned into a powerful 'X' debugging tool. It greatly increase the 'X' propagation debug efficiency.